In front-end development, end-to-end (E2E) testing, which verifies an entire application including UI behavior, is becoming increasingly important. However, the difficulty of introducing and operating E2E tests may keep some teams from putting them into practice.
This article is split into two parts and explains the process of introducing and using E2E testing with Playwright, using a simple web application as the example.
In Part 1, we covered how to set up Playwright, how to write basic test code, and how to run tests. In this second part, we will look at Playwright’s tracing feature, which helps identify why a test failed. We will also cover how to run tests automatically in a CI environment.
Who this article is for
- Readers who understand the basics of Playwright and want to move to the next step
- Developers who want to integrate Playwright into team development or a CI environment
After reading this article, you will be able to
- Use tracing to analyze why a test failed
- Integrate Playwright with GitHub Actions and run E2E tests automatically in CI
The project containing the test code used in this article is available below. You can run it locally, so try it out.
First, let’s look at Trace Viewer, which is useful for identifying the cause of test failures.
Trace Viewer
Trace Viewer is a feature that helps with debugging when a test fails. The operations performed during the test, network requests, and screenshots are recorded as a trace, allowing you to reproduce later what the test did and where it failed.
Add trace settings to playwright.config.ts. If you also add reporter settings, an HTML report will be generated, making it easy to access Trace Viewer for each test.
▼playwright.config.ts
import {defineConfig, devices} from '@playwright/test';

export default defineConfig({
  // ... (omitted)

  // Generate an HTML report. If a test fails, open it automatically after the test run.
  reporter: [['html', { open: 'on-failure' }]],
  use: {
    // ... (omitted)

    // In this article, tracing is always enabled ('on') for verification.
    // In production, use 'retain-on-failure' (save only on failure) or,
    // in CI, 'on-first-retry' (save only on retry).
    trace: 'on',
  },
  // ... (omitted)
});
Now reports and traces are generated when tests run. To check how this works, intentionally change the test so that it fails, then run it.
▼tests/app.spec.ts
import {expect, test} from '@playwright/test';

test('the counter button increments when clicked', async ({page}) => {
  await page.goto('/');
  // Get the button Locator
  const counter = page.getByRole('button', {name: 'count is'});
  // Assert the Locator text
  await expect(counter).toHaveText('count is 0');
  // Operate on the Locator
  await counter.click();
  // Assert the Locator text
  await expect(counter).toHaveText('count is 2'); // Change the expected value from 1 to 2 to intentionally fail the test
});
▼Run the command added to npm scripts ("e2eTest": "playwright test")
npm run e2eTest
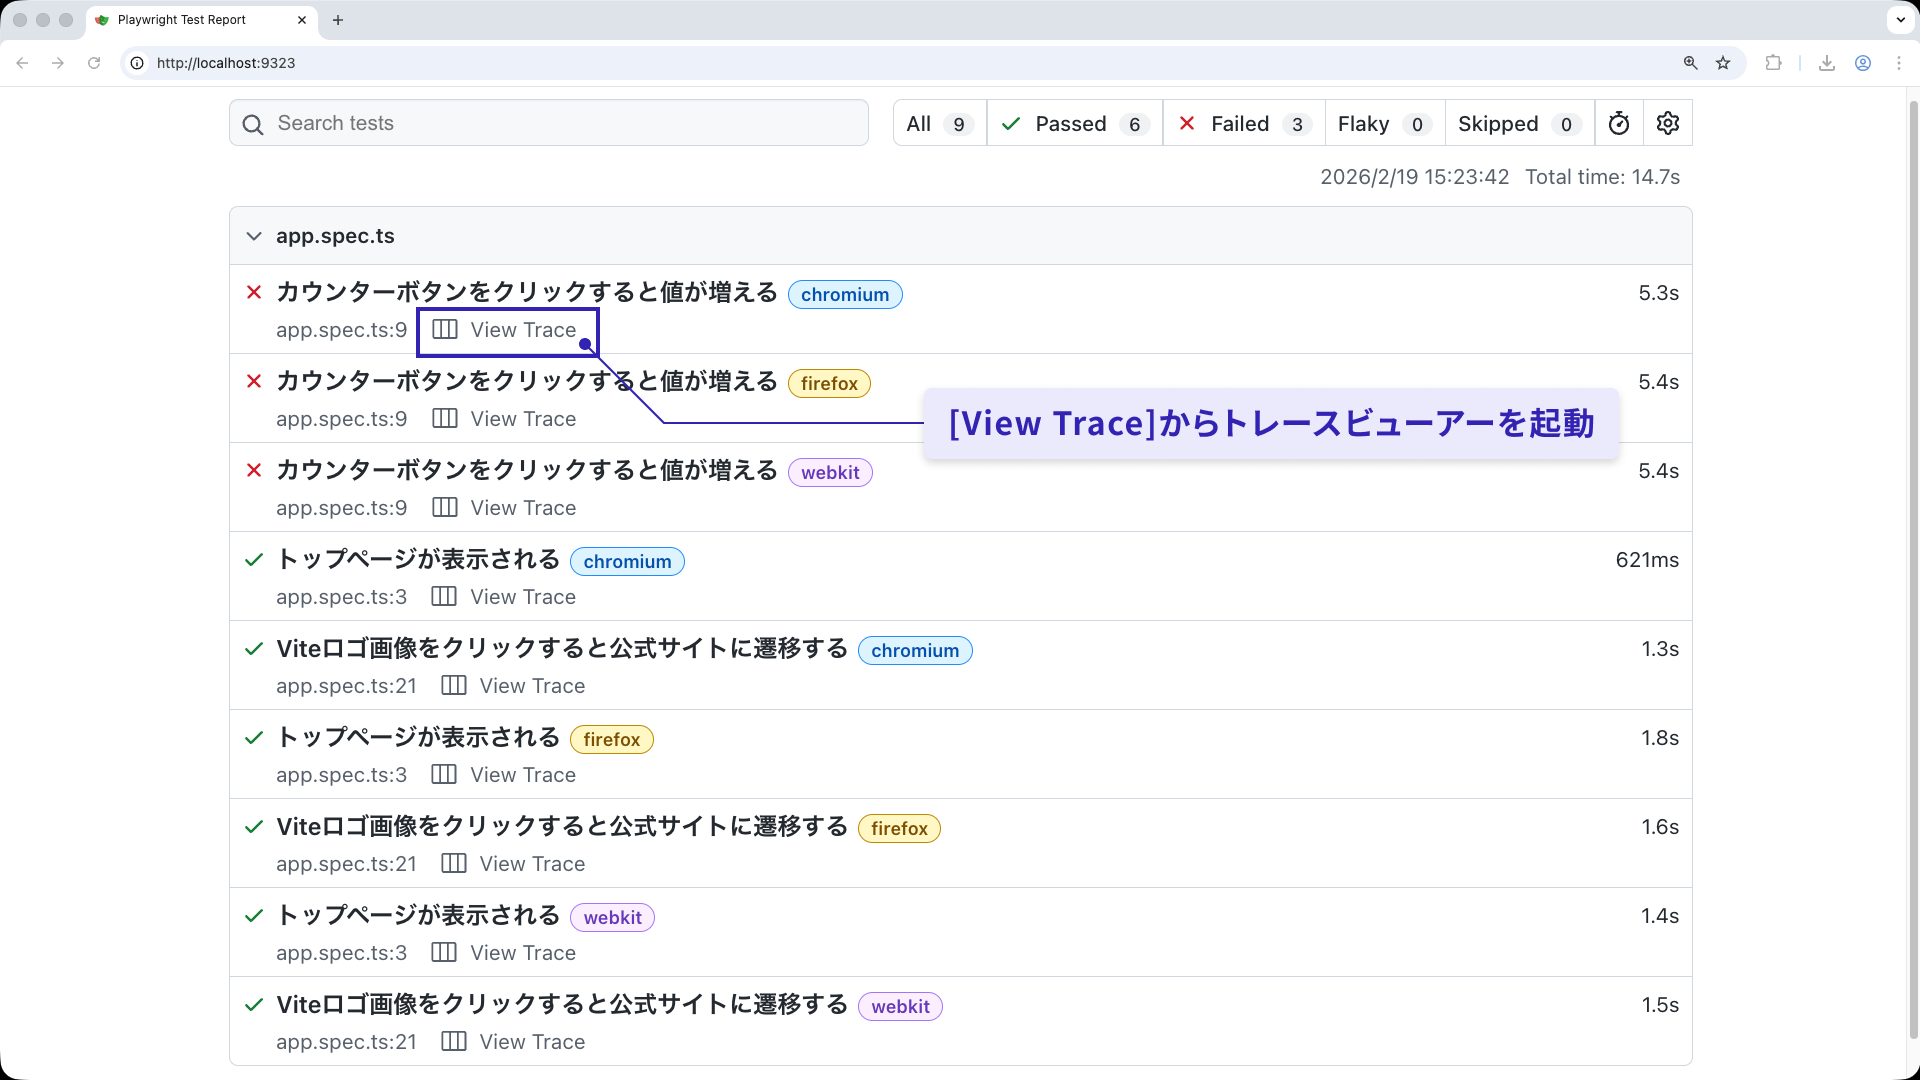
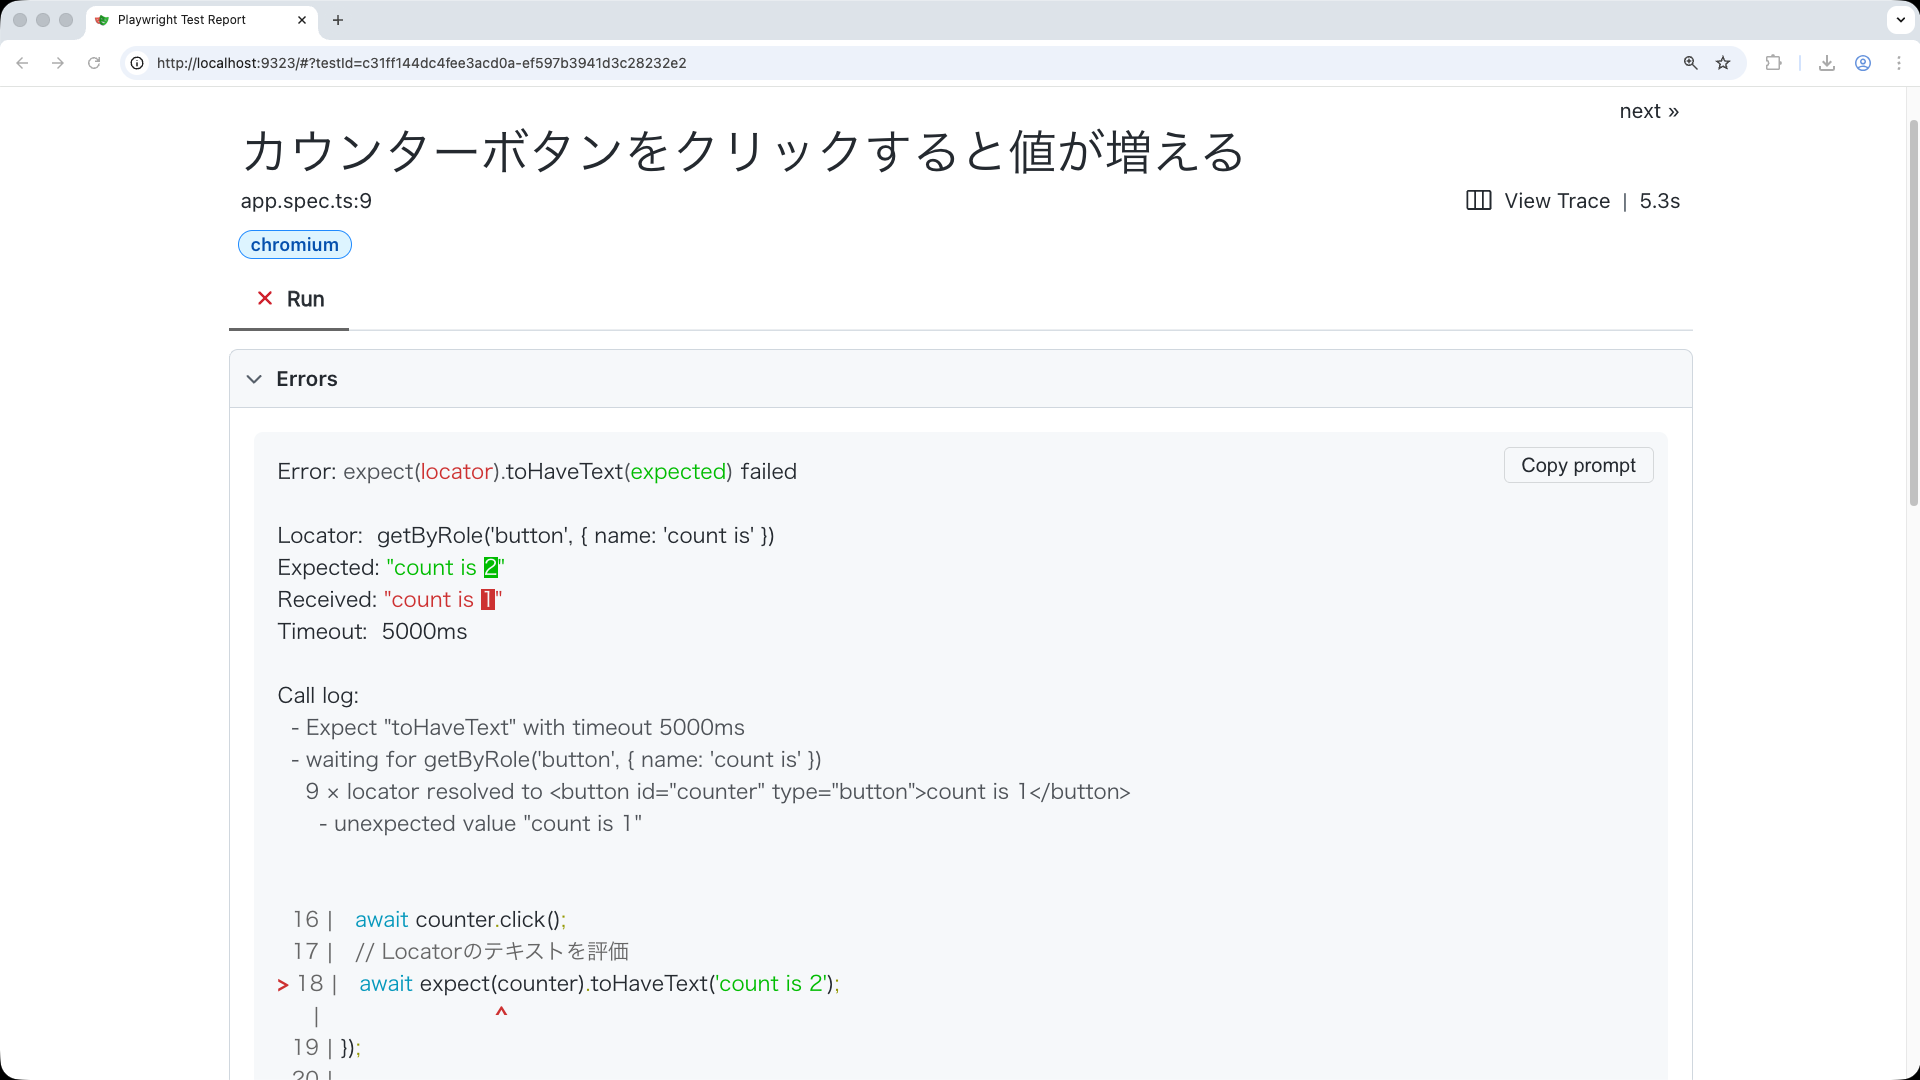
When the test fails, the report opens automatically. The failed tests are shown in a list. When you select the target test, you can see the error details and a link to Trace Viewer.
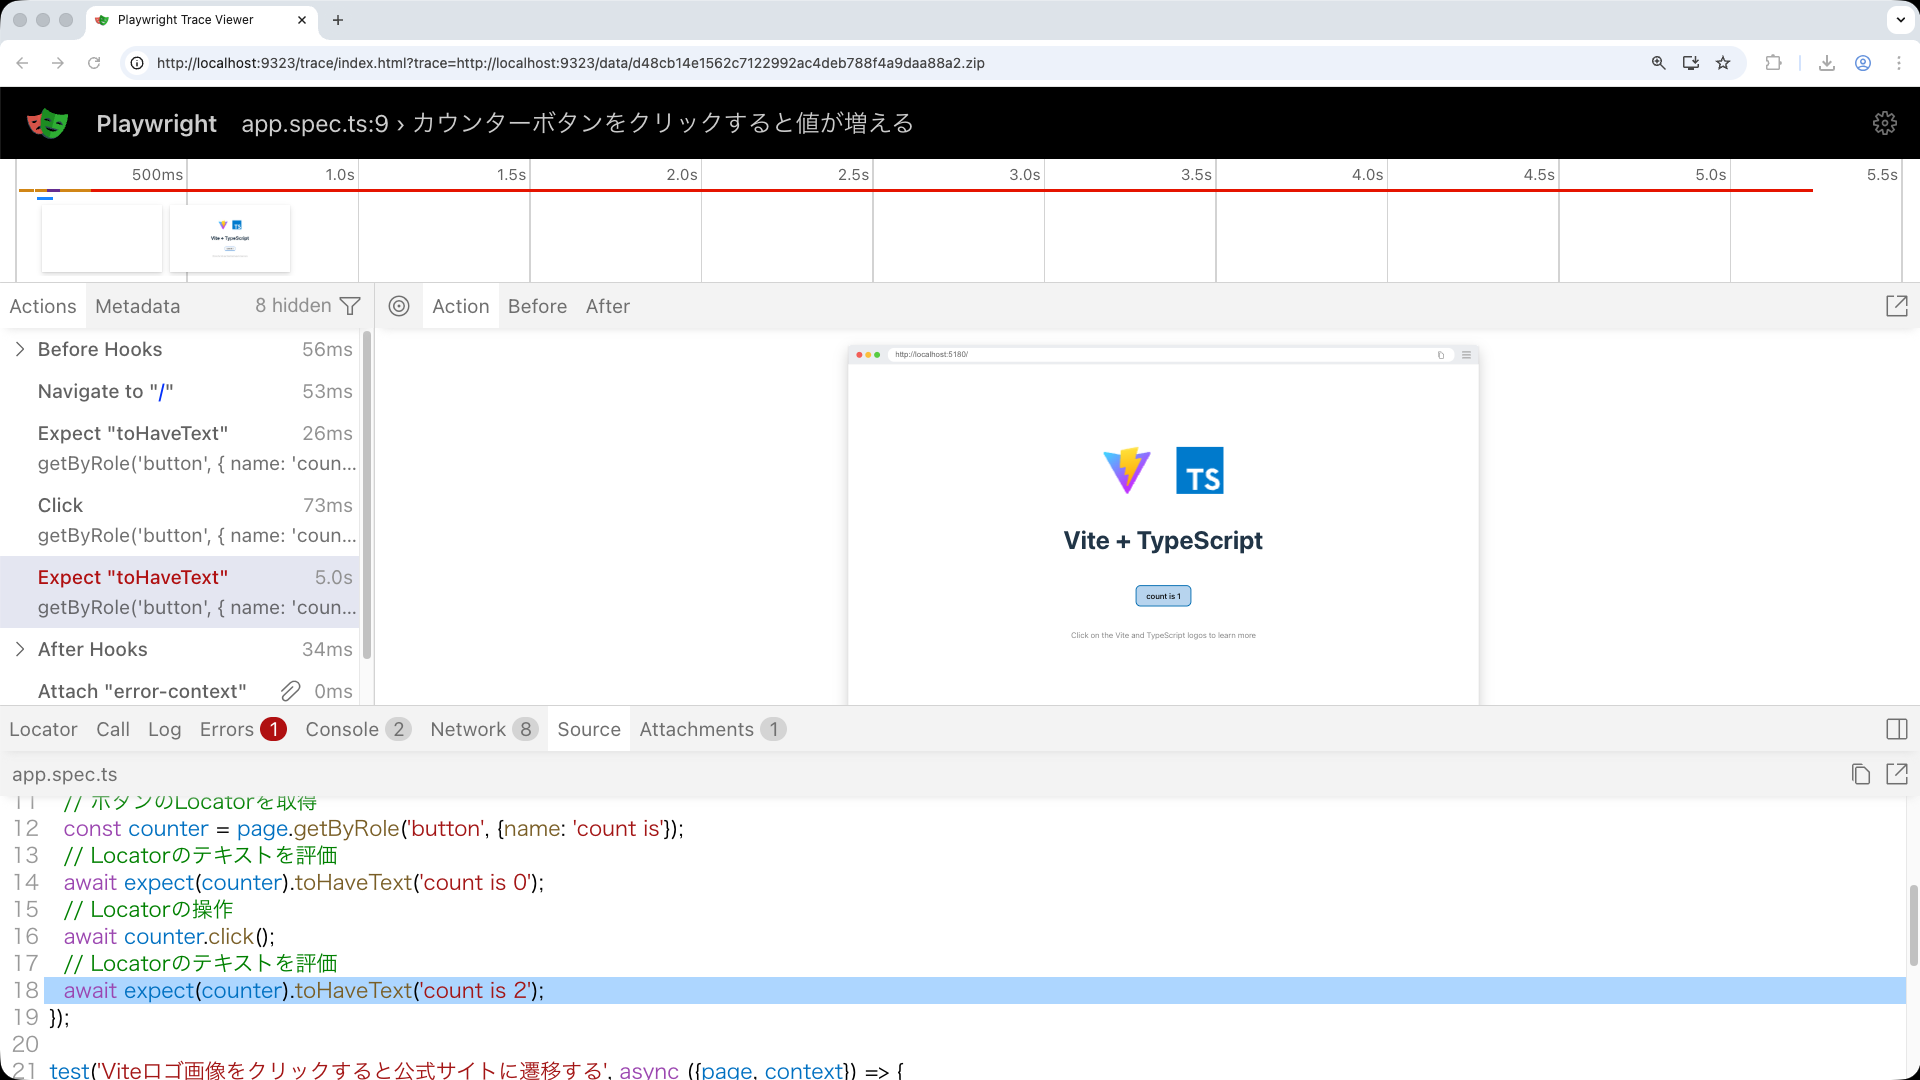
Select [View Trace] to launch Trace Viewer and reproduce the test’s operation history. You can check which operation failed, along with network request results, screenshots, and other details.
▼Generate an HTML report with the reporter. You can get an overview of the test results.
▼Select the failed test in the report to check the error location.
▼Check the detailed operation history in Trace Viewer. You can replay operations and inspect screenshots and network requests.
To open the report manually later, run the following command.
▼Run from the console
npx playwright show-report
Traces are saved under test-results. A directory is created for each test, and trace.zip is generated inside it. You can also open Trace Viewer directly with the following command, without going through the report.
▼Run from the console. Replace ... with the actual generated directory name.
npx playwright show-trace test-results/.../trace.zip
The show-trace command is also useful when reproducing a trace.zip from a failed CI test, covered later, on your local machine.
One of Playwright’s major strengths is that even when a test fails, you can visualize why it failed.
CI integration with GitHub Actions
By combining Playwright with CI, you can run E2E tests automatically whenever changes are made. Running tests for each pull request provides the following benefits.
- Reduces the amount of manual checking, leaving more time for review and implementation
- Detects bugs early, while the cost of fixing them is still low
- Makes it easier to understand the impact on existing features, so changes can be made with confidence
This article uses GitHub Actions as the example. You can run GitHub Actions by adding a YAML file to the .github/workflows directory in your GitHub repository.
▼.github/workflows/playwright.yml: a minimal workflow example
name: Playwright E2E tests

on: pull_request

jobs:
  e2e:
    name: Playwright browser E2E tests
    runs-on: ubuntu-latest

    steps:
      - name: Check out repository
        uses: actions/checkout@v6

      - name: Set up Node.js
        uses: actions/setup-node@v6
        with:
          node-version: lts/*

      - name: Install dependencies
        run: npm ci

      - name: Install Playwright browsers
        run: npx playwright install --with-deps

      - name: Run E2E tests
        run: npx playwright test

      - name: Upload test report
        if: always()
        uses: actions/upload-artifact@v4
        with:
          name: Playwright_test_report
          path: playwright-report/

      - name: Upload test traces
        if: always()
        uses: actions/upload-artifact@v4
        with:
          name: Playwright_test_traces
          path: test-results/
The on: pull_request setting makes this workflow run for pull requests. As shown in steps, it runs the following processes in order.
- Check out the repository
- Set up Node.js
- Install dependencies
- Install Playwright browsers
- Run the E2E tests
- Upload the test report if one was created
- Upload the test traces if they were created
The main action you want is step 5, running the tests. Before that, steps 1 to 4 are required as preparation. GitHub Actions runs in a clean environment, so Node.js, dependencies, and browsers must be installed each time.
Steps 6 and 7 upload the test report and traces to GitHub Actions. By downloading the saved files, you can inspect the detailed test results later.
Whether test reports and traces are generated depends on the settings in playwright.config.ts. Configure appropriate values in advance. If you want to enable them only when running in CI, use the CI environment variable.
▼Branch the playwright.config.ts settings when running in CI
import {defineConfig, devices} from '@playwright/test';

// GitHub Actions sets CI=true when it runs
const isCI = !!process.env.CI;

export default defineConfig({
  // ... (omitted)

  use: {
    // ... (omitted)

    // In CI, save traces only when a test fails. Locally, always enable traces.
    trace: isCI ? 'retain-on-failure' : 'on',
  },
  // ... (omitted)
});
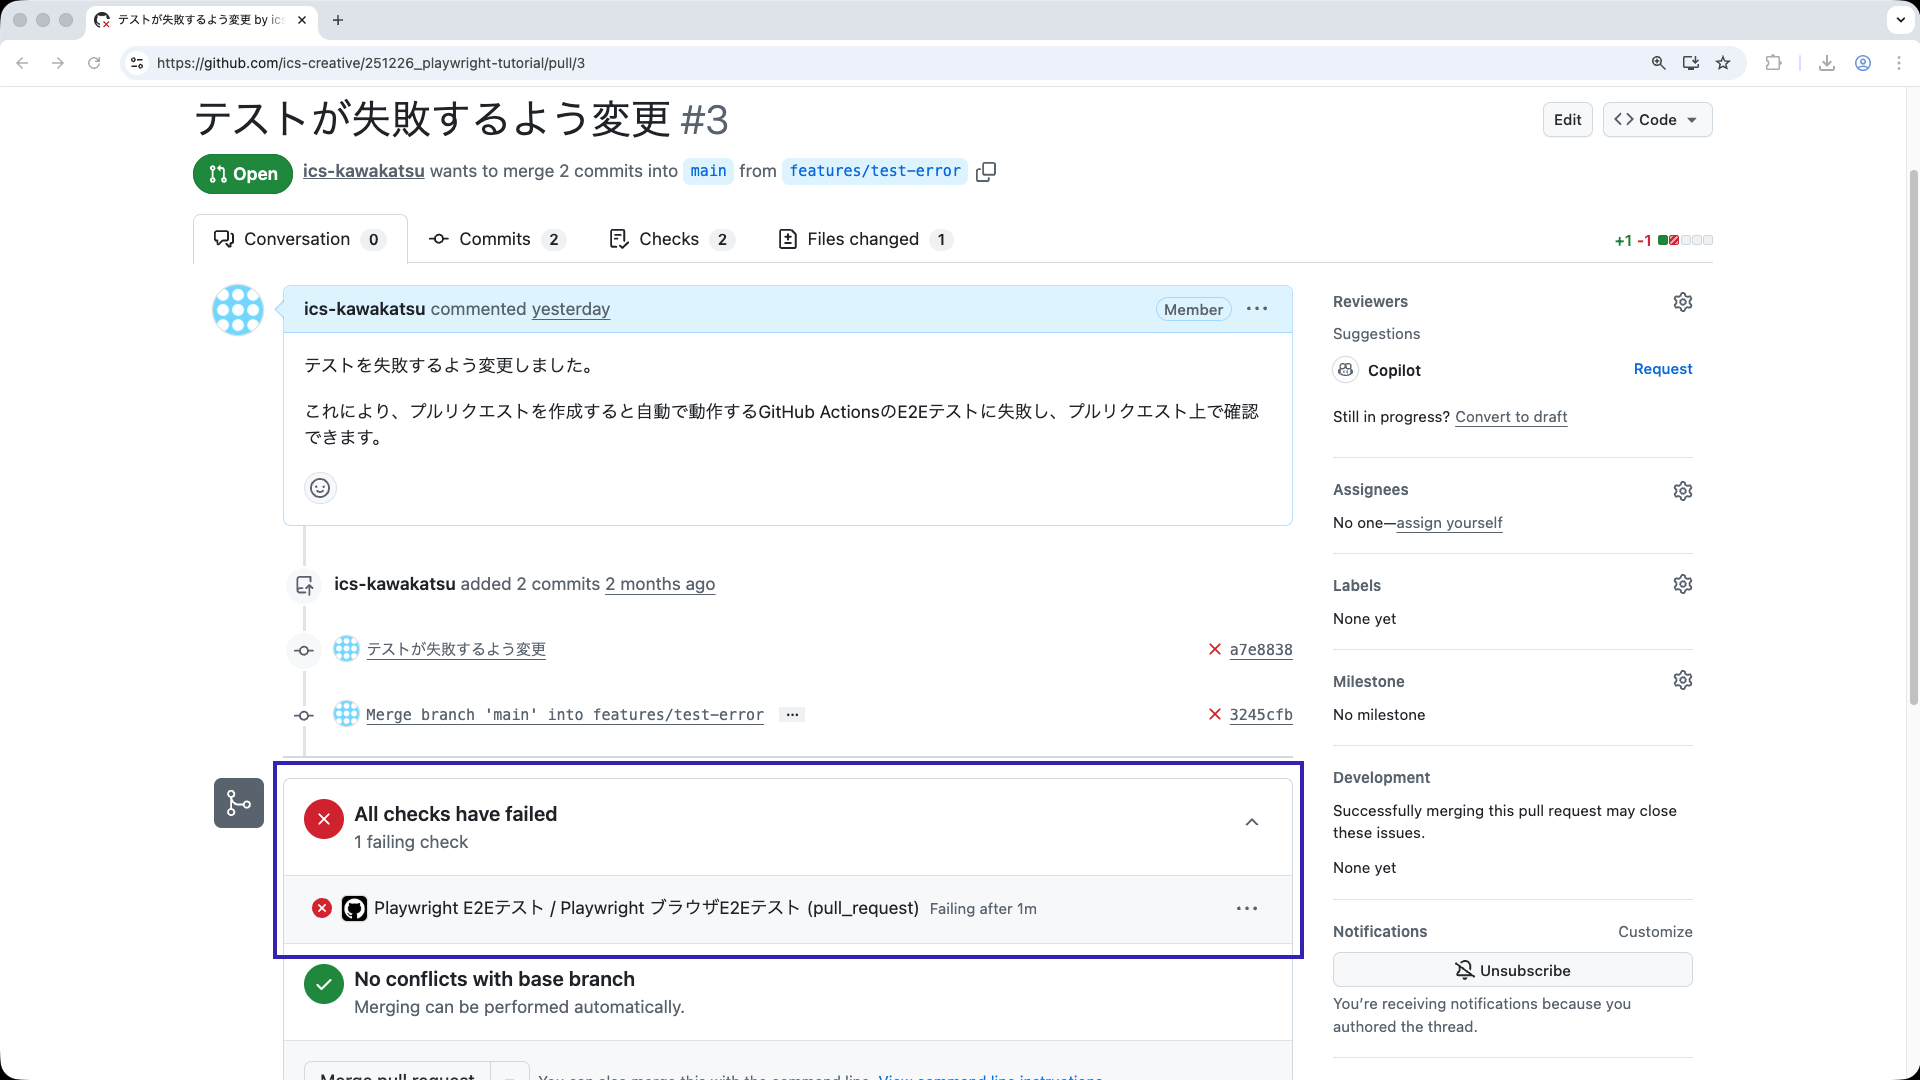
You can check a pull request where GitHub Actions actually ran and the E2E test failed below.
▼Create a pull request after changing the code so the test fails. You can confirm that GitHub Actions failed.
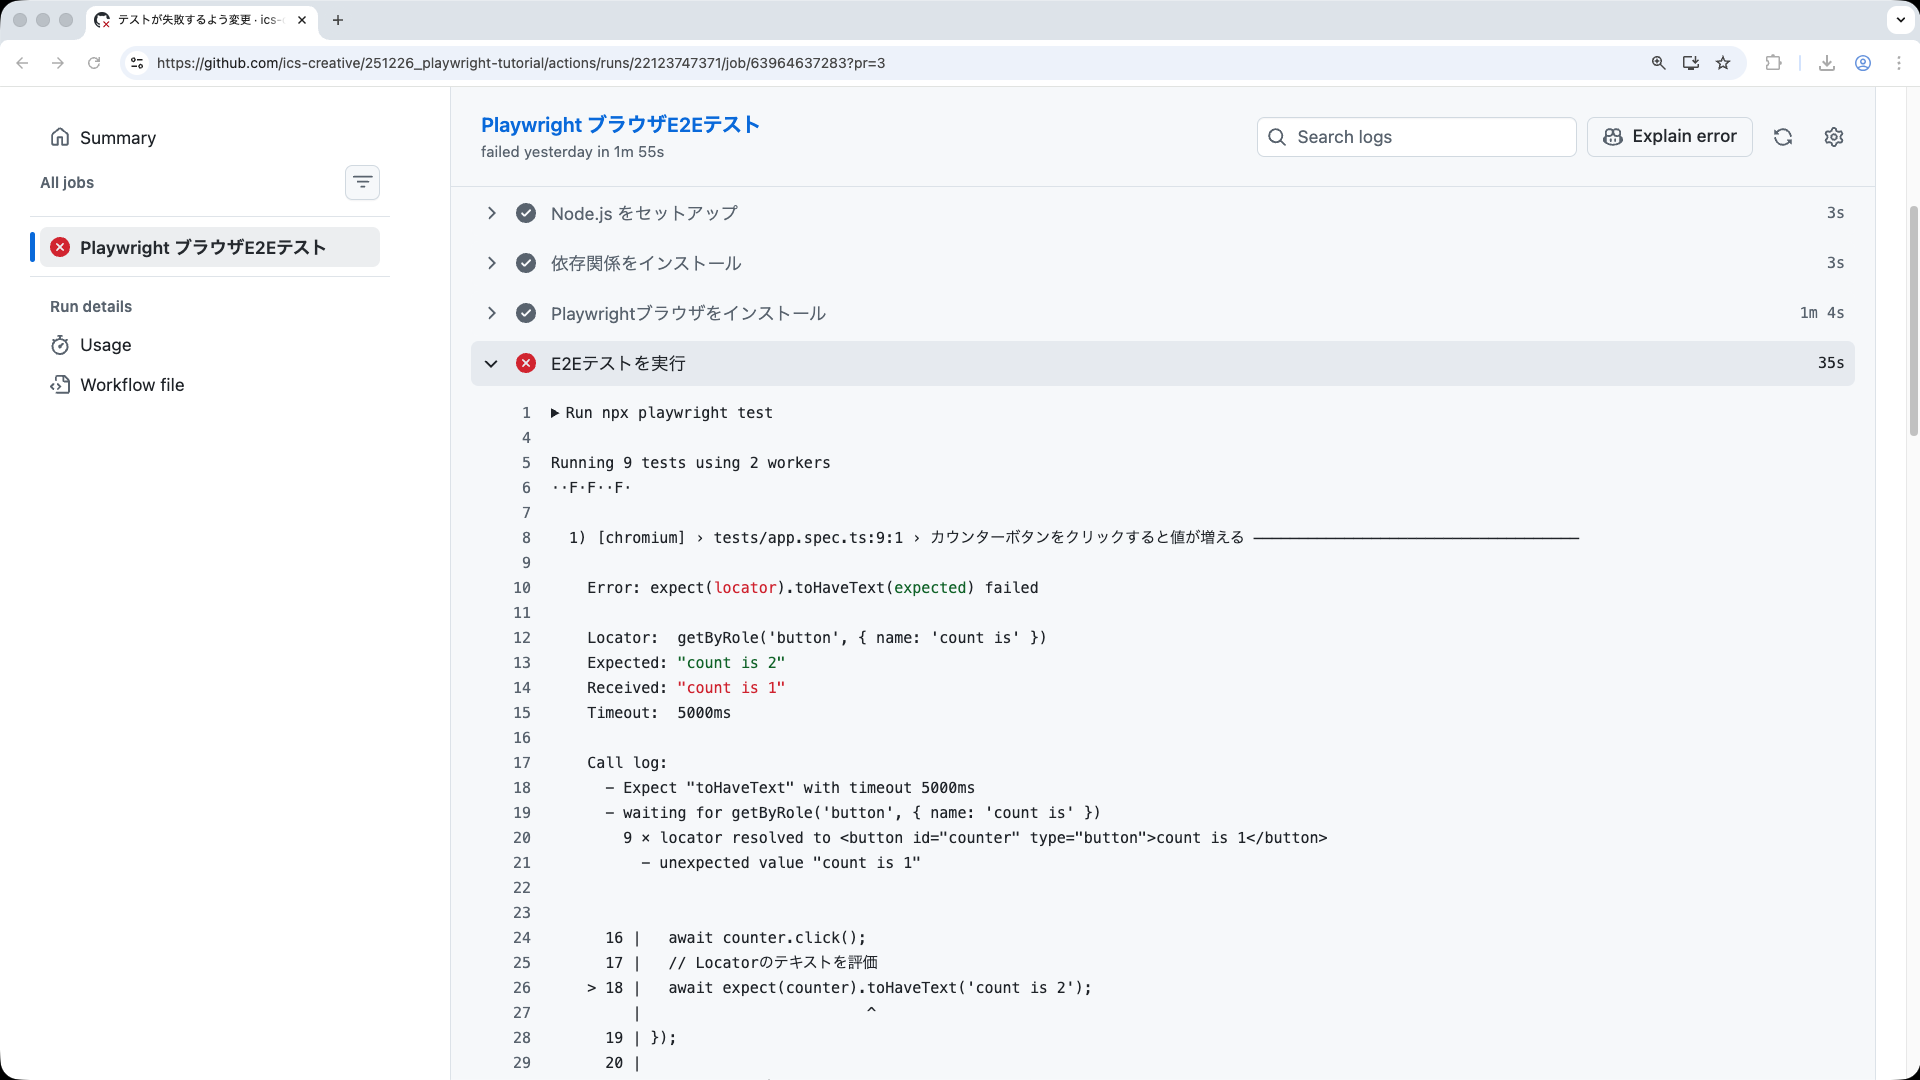
▼Check the details of the failed GitHub Actions run.
▼Because trace.zip is saved as a GitHub Actions artifact, you can download it and inspect it locally in Trace Viewer.
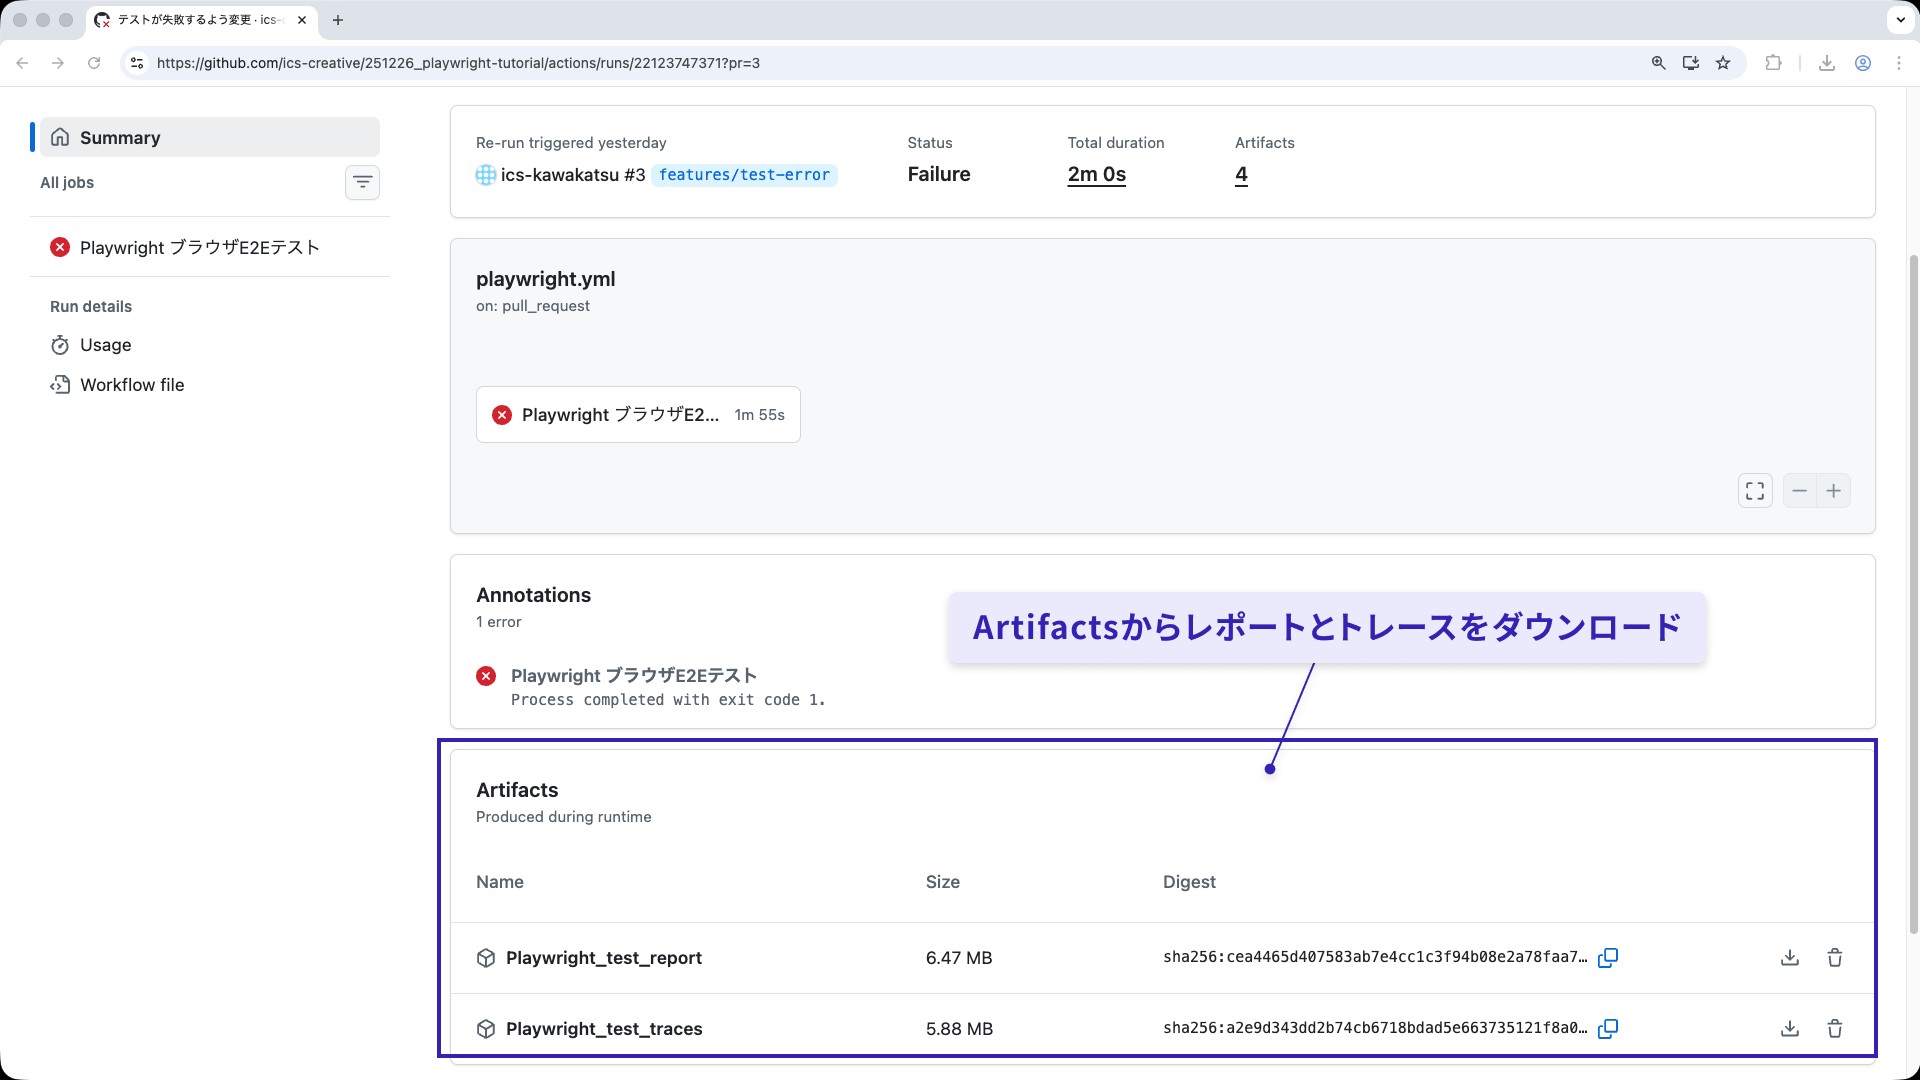
Note: ZIP files downloaded from GitHub Actions must be extracted before use.
- For the test report (
Playwright_test_report.zip), pass the extracted directory to thenpx playwright show-report <report-directory-path>command. - For the test traces (
Playwright_test_traces.zip), pass thetrace.zipfile inside the extracted directory to thenpx playwright show-trace <trace.zip-file-path>command.
By integrating Playwright into CI, tests run automatically whenever changes are made, making it easier to check the impact on existing features. This improves development efficiency and helps detect bugs early. Consider integrating Playwright into your CI environment as well.
Column: Playwright in the AI era
Playwright is also making progress in integrations with AI agents. Implementations that support the CLI and MCP are available, allowing browser operations and test execution to be controlled from AI.
In the future, combining Playwright with AI may become one of the options for test operation. If you are interested in using Playwright with AI, check out the related repositories below.
- Playwright CLI: A tool for running Playwright from the command line to control browser operations and tests. It can also be used from AI agents.
- Playwright MCP: An implementation that supports MCP, a standard for connecting AI tools with external tools.
Conclusion
In this second part, we covered how to debug with Playwright’s tracing feature and how to integrate Playwright with CI using GitHub Actions.
Tests are not something you write once and leave behind. What matters is being able to analyze failures and run tests continuously. Use traces to investigate the cause of failures, and run tests every time through CI. With this flow in place, E2E testing becomes a system that naturally supports day-to-day development.
Together with Part 1, this should give you a complete overview of the basics and operation of E2E testing with Playwright. Try introducing it into your own project.